
What we know
- 525 patients are on the 2012/13 QOF register within GP practices for Palliative Care for Central Bedfordshire.
- 1969 deaths occurred in Central Bedfordshire in 2012
Figure 1 shows deaths from all ages in Central Bedfordshire by disease category for 2012/13. 75% of deaths in that year are from circulatory diseases, cancer and respiratory disease.
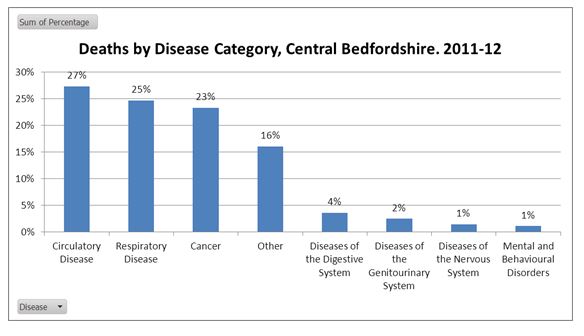
Figure 1: Death by Disease Category Source: ONS Mortality file
Place of death
National targets
- There is a Supporting Quality Target to achieve 50% of deaths in usual place of residence by March 2014. This target has been set to bring about improvements in end of life care. The majority of people would prefer to die or be cared for at the end of life at home. There is a research evidence that patients who receive palliative care have improved quality of life, better symptom control and have reduced costs from fewer hospital admissions and that those that receive palliative care are more likely to die at home (or reduced chance of dying in hospital).
- Figure 2 is a time-line of the proportion of deaths in usual place of residence in Central Bedfordshire, East of England and nationally. Central Bedfordshire deaths in usual place of residence Q3 2012/13 is 41.1% For this same Q3, 49.1% of deaths occurred in hospital
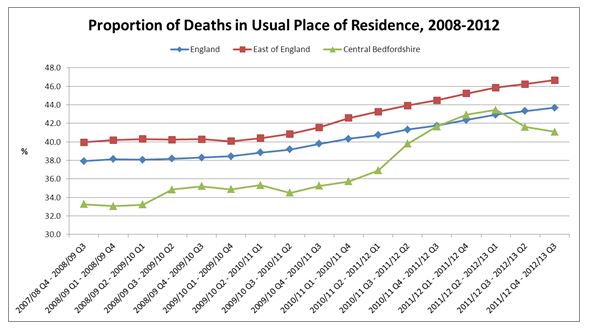
Figure 2: Time line for proportion of deaths in usual place of residence 2008 -12. (Rolling 12 months ) Source: ERPHO & ONS PHMF
Over time the proportions of deaths that occur in hospital have reduced, whilst those at home have increased. The proportion occurring in hospice setting have remained similar over time.
Within Central Bedfordshire the rate of improvement from a low base has been steep in the year covering 11/12 but appears to have declined in the last 6 months of 2012. The reason for this variation is not known from the data presented.
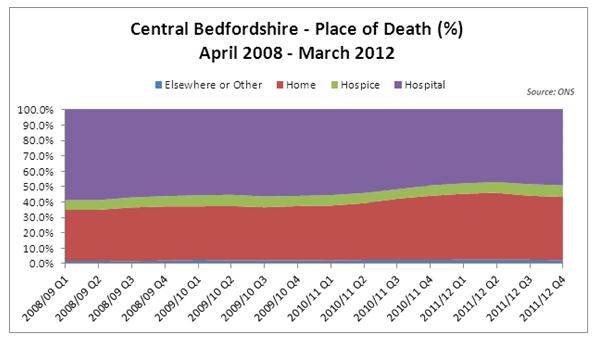
Figure 3: Time line for place of death 2008- 12
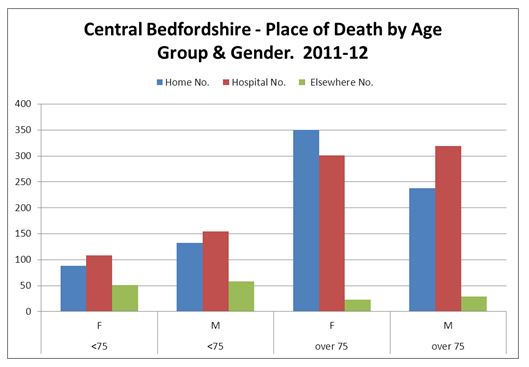
Figure 4: Place of death by age and gender
The above chart shows that breakdown by age and gender. It would appear that in the ‘elsewhere’ category relating mainly to hospice deaths, the numbers and proportions are highest in the under 75s. In the over 75s there appears to be a higher proportion of males dying in hospitals, although this does not reach statistical significance. For all ages the proportion of males where place of death is in hospital is 50.9% (CI 47.7 – 54.1) which is higher than the rate for females (44.4% (CI 41.2 – 47.6%)). This difference in gender can be accounted for at least in part by the wider use of residential and nursing care in older females, who are more likely to live alone in older age.
Last updated Tuesday, 12th July 2016